5.4.2 Model diagnostics
It is possible to perform tests of the regression model against the data being analyzed, in order to check whether the selected model needs to be moderated. This is done by specifying options for the relevant test parameters to be displayed. The regression result will then include the parameter values below the main table.
The following options can be used for model testing:
-
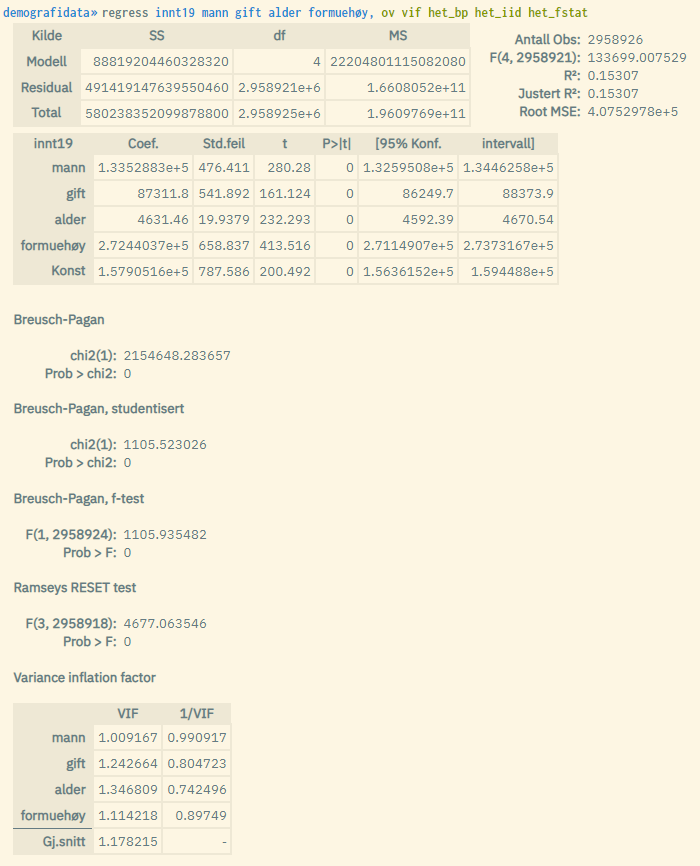
ov: Ramsey's RESET test for omitted variables. Displays a total F-value with associated P-value -
vif: Variance inflation factor test for multicollinearity. Displays variance inflation factor (VIF) values for the independent variables in a table -
het_bp: Breusch-Pagan test for heteroskedasticity. Displays a total chi-square value with the corresponding P-value -
het_iid: Studentized Breusch-Pagan test for heteroskedasticity. Displays a total chi-square value with the corresponding P-value (a newer version of the BP test that is more robust since it does not assume that the residuals are normally distributed) -
het_fstat: F-statistics from the Breusch-Pagan test for heteroskedasticity. Displays a total F-value with associated P-value. The number of degrees of freedom is not based on the number of variables in the regression model, but stems from an additional OLS model that compares residuals and predicted values. Therefore only one degree of freedom
Example of a test for omitted variables, multicollinearity and heteroskedasticity:
regress income2019 man married age highwealth, ov vif het_bp
Result (retrieves all test parametres):
There are also other methods in microdata.no to test regression models:
-
The
correlatecommand provides pairwise measures of correlation between individual variables in a table matrix. This can reveal multicollinearity. Section 5.1 reviews this command. -
The
regress-predictcommand provides the opportunity to study e.g. residual and prediction values. This can be combined with graphical tools such as histogram to show residual distributions and to check for e.g. normal distribution. Thehexbincommand can also display an anonymized 2-way plot. See section 5.4.4 for a review of this command.